Linear Regression Using Numpy
By
 ·
·
Interview
·
·
Interview
Join the DZone community and get the full member experience.
Join For FreeA few posts ago, we saw how to use the function
numpy.linalg.lstsq(...) to solve an over-determined system. This time,
we'll use it to estimate the parameters of a regression line.
A linear regression line is of the form w1x+w2=y and it is the line that minimizes the sum of the squares of the distance from each data point to the line. So, given n pairs of data (xi, yi), the parameters that we are looking for are w1 and w2 which minimize the error

and we can compute the parameter vector w = (w1 , w2)T as the least-squares solution of the following over-determined system

Let's use numpy to compute the regression line:

You can find more about data fitting using numpy in the following posts:
A linear regression line is of the form w1x+w2=y and it is the line that minimizes the sum of the squares of the distance from each data point to the line. So, given n pairs of data (xi, yi), the parameters that we are looking for are w1 and w2 which minimize the error
and we can compute the parameter vector w = (w1 , w2)T as the least-squares solution of the following over-determined system
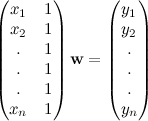
Let's use numpy to compute the regression line:
from numpy import arange,array,ones,random,linalg
from pylab import plot,show

xi = arange(0,9)
A = array([ xi, ones(9)])
# linearly generated sequence
y = [19, 20, 20.5, 21.5, 22, 23, 23, 25.5, 24]
w = linalg.lstsq(A.T,y)[0] # obtaining the parameters

# plotting the line
line = w[0]*xi+w[1] # regression line
plot(xi,line,'r-',xi,y,'o')
show()
We can see the result in the plot below.

You can find more about data fitting using numpy in the following posts:
Linear regression
NumPy
Published at DZone with permission of Giuseppe Vettigli, DZone MVB. See the original article here.
Opinions expressed by DZone contributors are their own.
Comments